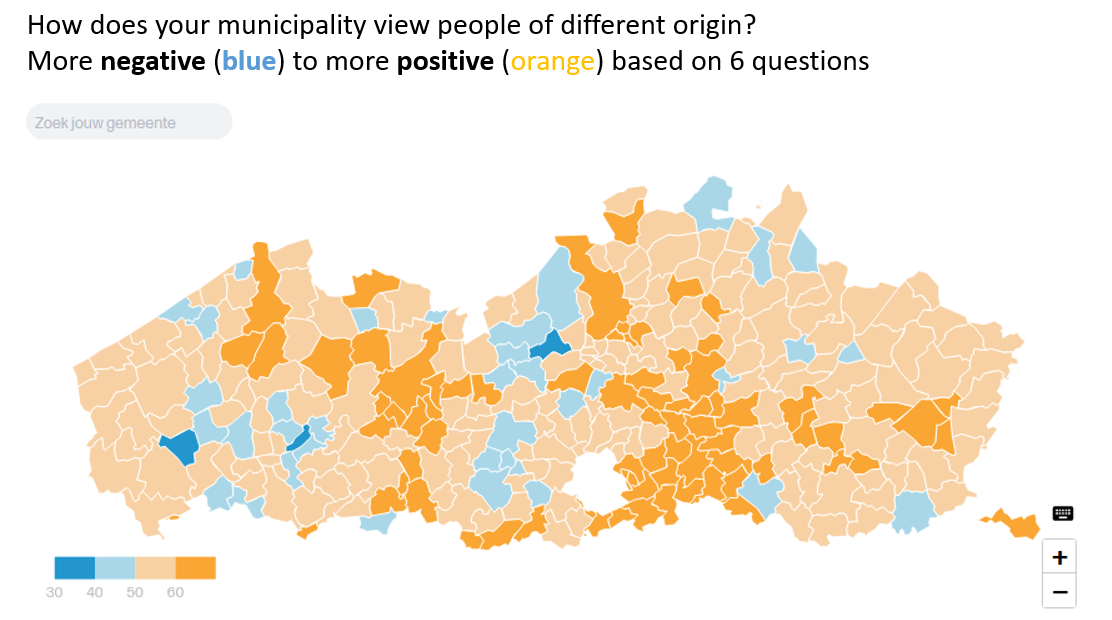
The piece starts with the following (automatic translation): “Unknown often remains unloved: discover more about diversity and integration in your municipality. Almost 1 in 3 Flemish people thinks that there are too many people of different origin living in their municipality. 7 out of 10 Flemish people almost never say they have a chat. The differences between municipalities are large. VRT NWS delved into the figures that the Agency for Home Affairs recently bundled in the Local Integration Scan. Search for your municipality below to view the situation in your area.”
Following the introduction and catchy phrases, there are some interactive maps where you can enter where you live in Belgium, and read about people’s perception with regards to people with an immigration background:
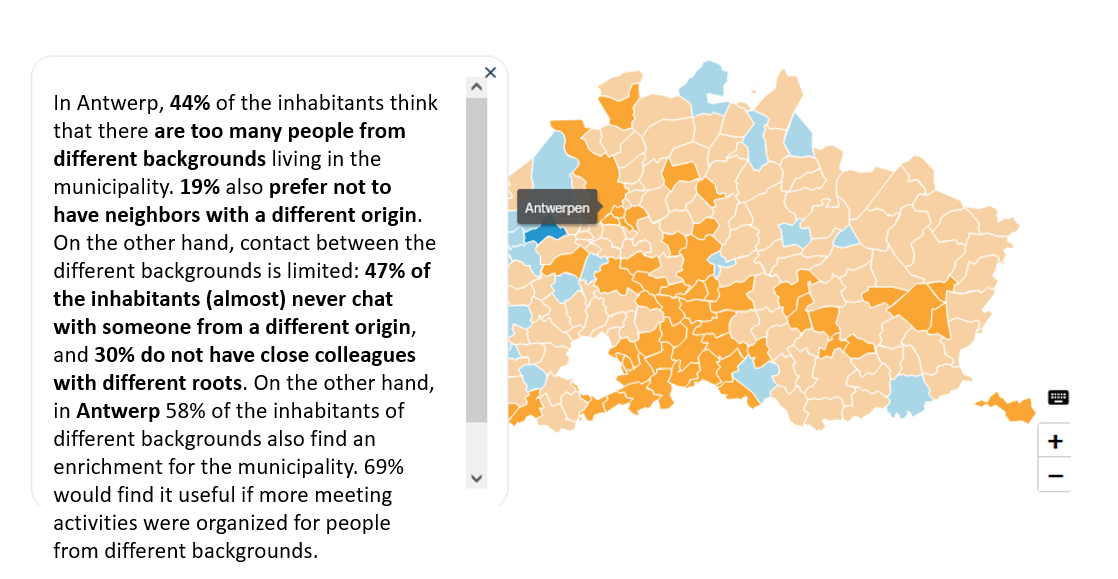
When I selected where I live, I was presented with the following information (translation from the original Dutch is done by Google Translate):
When using Emacs, I don’t spend time thinking about fonts most of the time. Like the majority, I pick my favorite fixed width, mono space font and get on with it. Every now and then I can hear about some cool new font for reading lots of software source code and technical writing, and I might give it a try, but that’s the end of it.
But sometimes, you just want to have an overview and see everything summed up in a single place, preferably an Emacs buffer so you can also play with it and hack it. Of course, your GNU/Linux, macOS, or MS Windows will happily show you all the available fonts, and let you filter out fixed width ones suitable for programming. Emacs itself can also do something very similar. But as I said, why not have something according to your taste?
With a bit of Emacs Lisp, it seems not that difficult, at least on GNU/Linux:
This file contains bidirectional Unicode text that may be interpreted or compiled differently than what appears below. To review, open the file in an editor that reveals hidden Unicode characters. Learn more about bidirectional Unicode characters
“The Heinz Nixdorf MuseumsForum (HNF; www.hnf.de) in Paderborn, Germany, is the world’s largest computer museum. The museum, which is also an established conference center, showcases the history of information technology—beginning with cuneiform writing and going right through to the latest developments in robotics, artificial intelligence, and ubiquitous computing.
The multimedia journey through time takes visitors through 5,000 years of history, starting with the origins of numbers and writing in Mesopotamia in 3000 B.C. and covering the entire cultural history of writing, calculating, and communications. Alongside typewriters and calculating machines, the exhibition shows punched card systems, a fully functioning automatic telephone exchange system from the 1950s, components from the earliest computer (which filled a whole room), over 700 pocket calculators, and the first PCs. Work environments from different centuries are also staged in the exhibition.
The exhibition highlights include fully functioning replicas of the Leibniz calculating machine and the Hollerith tabulating machine, a Thomas Arithmometer dating from 1850, a Jacquard loom operated with punched tape, components of the ENIAC from 1945, the on-board computer from the Gemini space capsule, the Apple 1, a LEGO Turing machine, and Europe’s largest collection of cipher machines. One of the current attractions at HNF is the world’s most famous automaton: Wolfgang von Kempelen’s chess playing machine, the Chess Turk, which dates from the 18th century.”
I was more than impressed, and wanted to visit Paderborn to see the world’s largest computer museum. I knew it was just a few hours away by car from Antwerp, but I’ve always postponed going there for various reasons. I didn’t want there to go alone, and I knew I needed someone like-minded enough to accompany me on this “nerdy” journey. Finally, last week, I and a physicist / data scientist friend of mine decided to go there, notwithstanding the weather conditions, and very snowy German highways.
I think this is the only museum where digital relics from my childhood and youth (1980s and 1990s) are considered as museum-worthy as replicas of 5000 year old Sumerian tablets! 🙂 It was pure joy and fascination to visit the halls of the museum, and be guided by very thematic and knowledgeable, gentle robots. One of them, Victoria, was a sight to be seen! The other one was also great, and you can watch “him” in action:
We’re living in the age of touch enabled wireless devices that are connected to Internet. We have instant video communication, and we can easily and cheaply organize video teleconferences with many participants. Scientists and programmers separated from each other by thousands of kilometers and many time zones collaborate on complex projects on a daily basis. It is almost natural to think that, without such technologies, we would be living in dark ages, and our greatest thinkers would suffer from isolation miserably. But is it really the case? Let’s see two examples from the world of mathematics and quantum physics.
De olifant in het bad is een interactief boek voor kinderen tussen 1 en 10 jaar oud. Het verhaal gaat over een meisje, Zara en een olifant. Zara hoort een gedruppel in het huis. Vanwaar zou dit toch komen? Is er een olifant in het bad misschien?
Laat je kind ermee spelen! Belletjes ploffen, de bal gooien, verschillende gereedschappen gebruiken om het bad te herstellen, de olifant meehelpen… Ontdek het verborgen object op elke pagina. Vind je het haar van Zara niet leuk? Verander het dan maar… Je kan zelfs de zon verplaatsen.
De Olifant in het Bad: Een interactieve iPad boek voor kinderen
Het originele versie van het boek is in het Engels. Het is vertaald en verteld door Tanya Gezgen zodat Nederlandstalige kinderen er ook veel plezier aan kunnen beleven. Read the rest of this entry »
“The International Space Apps Challenge team has collected these challenges from throughout NASA and our international partners to serve as an inspiration for projects that could be created. Our goal is to provide a platform for people interested in space exploration to get together to work on amazing projects together, and we encourage you to come up with your own projects and submit them for inclusion on this list on the Challenge Submission page.”
NASA International Space Apps Challenge
I’m happy to see that Istanbul was one of the selected locations.
Thanks to the members of Devoxx4Kids, I have recently learned about a very interesting event: Robocup Junior 2012. This year’s event is organized at Technopolis, so I decided to go there with my wife and 8 month old son today (well, it is never too early to start, right?).
I was really surprised by the number of children at the event. The robotics tournament took place at a hall and most of the kids were either rushing to place their various robots on different challenge tracks, or very concentrated and busy on their laptops, trying to do the last minute bug fixes.
From robots running for rescue missions, to the ones that solved Rubik’s cube, the event was full of excitement, hacking and creativity. I also had the chance to drop by the Dwengo stand to see their robotics kit, powered by the famous Dwengo board. All that is left to do now is to find out how I can introduce all of this robotics to my students who learn programming in Scratch.
Below you can watch a slideshow of photos from the event.
I have recently discovered a very interesting map on the dns.be web site. It shows the number of .be Internet domains per inhabitants as of 2011 in Belgium.
R in Action fills an important gap by introducing the basics of R and statistical data analysis from a very practical and pragmatic point of view. It has a broad coverage and after introducing basic data set manipulation techniques and commands, it goes on to describe many important statistical data analysis techniques from simple linear regression to more advanced methods such as ANOVA, power analysis, resampling, bootstrapping, generalized linear models, PCA, factor analysis, and handling missing values.
One of the nice features of the book is the description and discussion of many different visualization methods. The author, using many interesting and real world examples, shows how basic and more advanced visualization methods in R can be very helpful in exploring and understanding many different types of data sets. Read the rest of this entry »
GitHub Badge is a nice, little web utility that gives a 10.000 feet overview of your GitHub activity. It has a very high data-ink ratio, showing the programming languages you employ frequently, as well as some valuable statistics about your source code repositories. It is being developed out in the open by fellow hackers berkerpeksag and BYK.
GitHub Badge
This cute little application was the subject of well-deserved enthusiasm when I first saw it, and one of my immediate reactions were: “Hey, why don’t you add sparklines? Now, that would be cool, right?”. Apparently the developers listened and went on to spread more information visualization love. Well, now, don’t you consider this yet another reason to be fond of open source and interactive development that is becoming more and more popular every single day, thanks to the success of systems such as Github?
Oh, by the way, no, I’m not on vacation. Really. Err, maybe regarding my GitHub projects but… (Maybe I should open another issue for that 😉